Author: Matillion
Date Posted: Nov 8, 2023
Last Modified: Nov 16, 2023
Task History Profiler
Performance analysis and tuning for Matillion ETL jobs.
Run the Task History Profiler after your Matillion ETL job has finished running. It will help you understand which parts took the longest time to run, and how much ran in parallel.

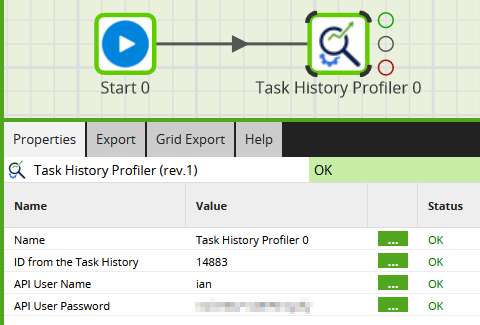
You can profile any Matillion ETL job run from the task history. To use the Task History Profiler Shared Job, drag it onto the canvas of a newly created Orchestration Job, and fill in the parameters.
This article on Matillion ETL Job Performance Analysis and Tuning contains much more information on how to interpret the output, and what steps you can take to tune jobs.
Parameters
| Parameter | Description |
|---|---|
| ID from the Task History | Set to the value you chose from the Task History, for example 14883 |
| API User Name | A Matillion ETL user, which must have API privilege |
| API User Password | The password for that user |
Prerequisites
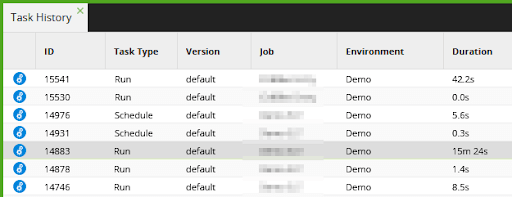
The job you are analyzing must have finished, and be visible in the task history, for example like this.

Performance analysis and tuning is most helpful with large Matillion ETL jobs that contain a lot of components, and that do a lot of data processing.
It is best to tune jobs that finished successfully and fully. However, you can still look at a job that failed, or a job that was deliberately run partially, to analyze the parts that did run.
The shared job uses jq, curl, gunzip and base64 internally. These utilities must be installed on the Matillion ETL instance.
Source code
The analysis is performed by a compiled version of this C program.
Downloads
Licensed under: Matillion Free Subscription License
- Download METL-1.61.6-task-history-profiler.melt
- Version: 1.61.6 or higher